So - in this post I'll use NDepend to analyse the codebase and see whether NDepend confirms what I've observed and whether it shares the concerns I have with the code. Also - this should allow me to create an objective report of the quality - which I could communicate up.
So let's get started. Since the first thing I did after onboarding onto the project, was migrate to GIT - I checked out the first commit, and I'll use this for the analysis. After doing a first analysis - we're presented with the dashboard:
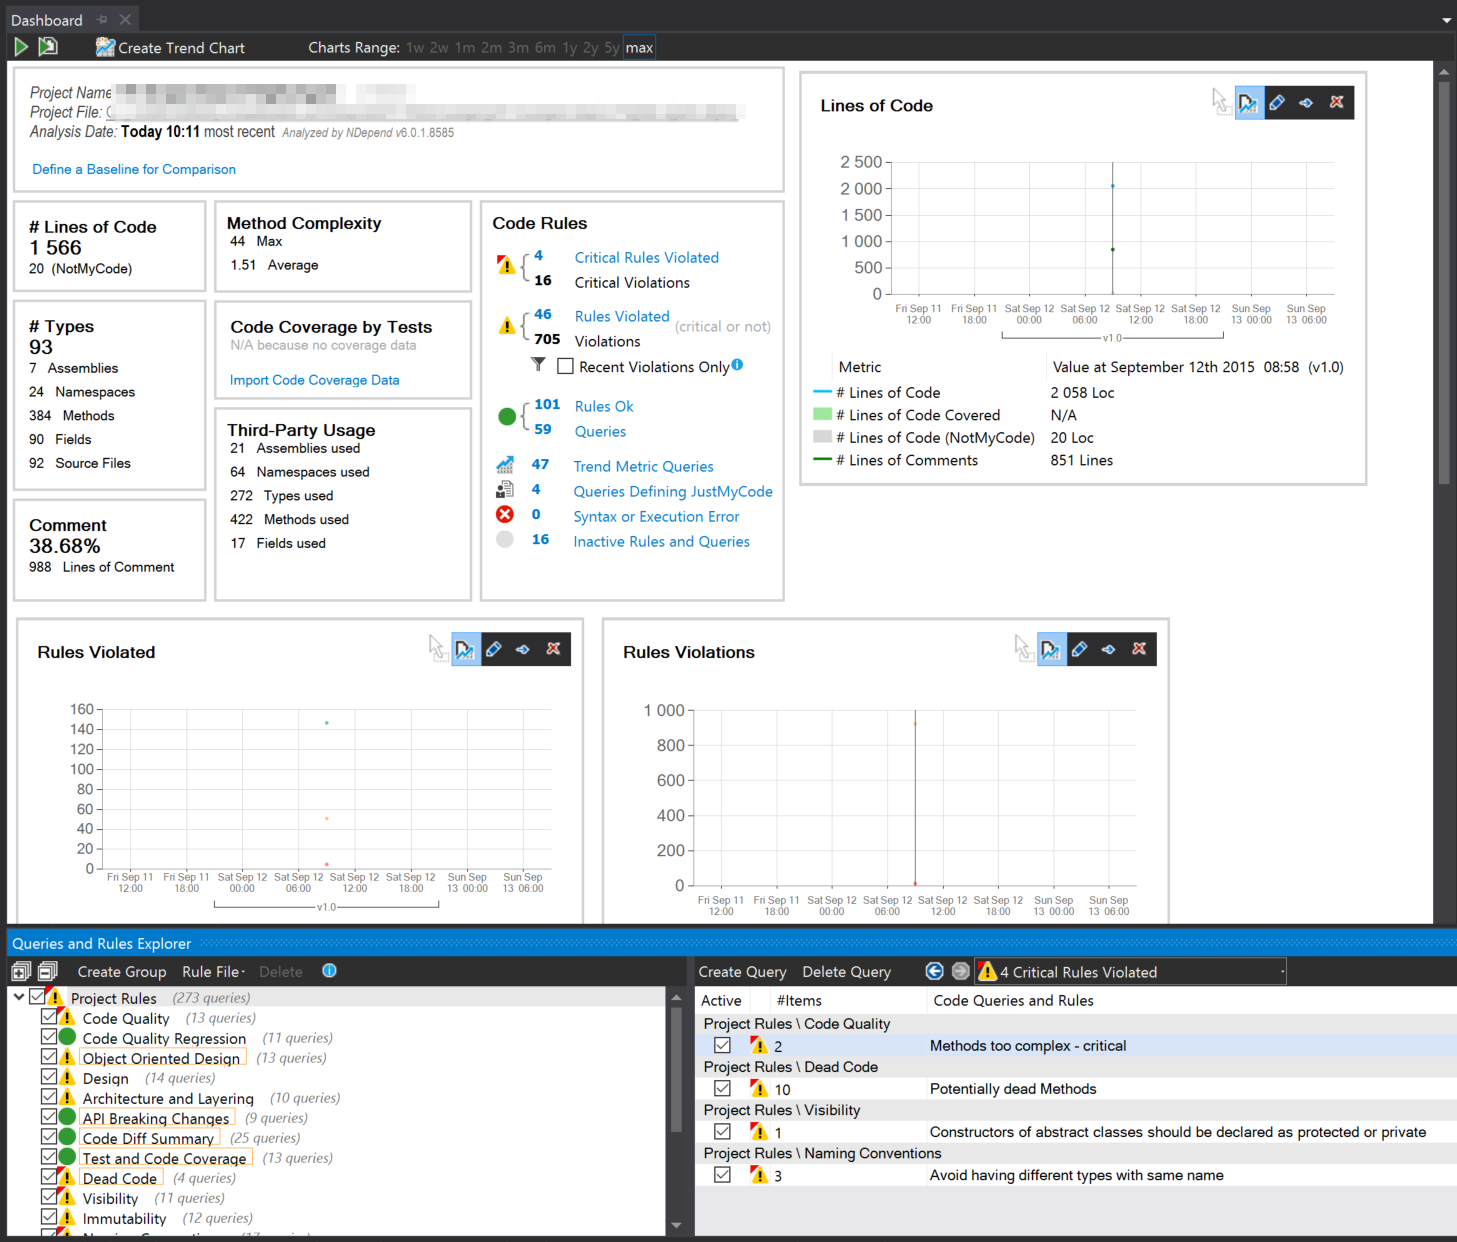
OK, so we've got some critical and non-critical rules being violated. Let's go into this. What's that top issue - 'Methods too complex - critical' rule flag - for one issue? First of all - what does it mean?

After clicking on the rule - the NDepend window shows the code query that gave a result, in other words, returned the method that violated the rule. So this rule flags methods with a cyclomatic complexity over 30 and 'IL cyclomatic complexity' over 60. That's interesting in itself: why would a higher IL complexity be allowed? I would have to think about that - but I suspect it has something to do with the fact that the compiler may do some optimisations on the code, that would actually increase IL CC.
By the way - if you don't know Cyclomatic Complexity - find it on WikiPedia: https://en.wikipedia.org/wiki/Cyclomatic_complexity - it's interesting and useful to know. Not only is it bad for maintainability to have high CC, it's also hard to get 100% code coverage from your tests since you're going to have to test every execution path.
Anyway - back on topic. So there's a method that's too complex. NDepend allow you to directly find the method it's flagged as too complex. Turns out the methods are:
- SomeRepository.Add()
- Some static void main() method
A bit of context: the solution I've opened is a console app that gathers data from sources on the internet and stores it into the database. The fact that there are critical violations in critical parts of the app - worries me.

Indeed - as it turns out - these methods were both 200+ lines and the program.cs file is over 700 lines. Test code coverage? 0%. OK, so these are probably areas that need some attention.
Let's move on the depenency graph:

So - this is quite a simple solution - with only 4 projects. What this graph indicates is that the Agent project - most likely - has too many responsibilities. That is indeed the project that has the program.cs with static void main method that is complex and long. So that makes sense.
Another observation is that the HT.Utilities is used by all the other projects. You see this more often where a library is used for cross-cutting concerns - so that would still be acceptable. But what's concerning is this:

The red bar on the right indicates that HT.Utilities takes dependencies on all kinds of other libraries ( both from the CLI and from NuGet ). That means that if you create a new project, and take a dependency on HT.Utilies, you get NLog, Automapper and Microsoft.ServiceBus for 'free' in your output folder.
On a tangent: later I made plugins for this application that were detected using Ninject assembly scanning. I bundled the plugin up using ILMerge. However, some of the implementations used HT.Utilities, thus I had to include all the above mentioned libraries in the plugin in order for it to run. Plugin size: 10 mb for 100kb original dll.
But is there another way to visualize these dependencies? Yes there is - the dependency graph.

.
This shows that all depend on HT.Utilities - and HT.Utilities depends on all kinds of goodness. In this screenshot I was hovering over HT.Utilies and the green shows me 'assemblies depending on ...' and blue of course 'assemblies depended on ...'.

Here's another screenshot of the same graph - this time I'm hovering over the 'Provider.Core' project. This touches back to the tangent: the idea was that all plugins should implement Provider.Core. That's all good - but since Provider.Core depends on HT.Utilities - the plugins require ServiceBus, Nlog and AutoMapper to be present in order to load. Bundling them means a 10mb plugin file.
OK - so HT.Utilities probably needs to be split up. There's another todo we find from the analysis.
Now, let's move on to the endboss of NDepened visualisations: the code metrics view:

This is the default view - and the two 'usual suspects' by now - immediately jump out. The Main() and Add() method.
A quick glance at the control bar at the top explains why: the color indicates the IL complexity - the size of the block is determined by the LOC ( Lines Of Code ). These can of course be covariant - but not necessarily. So now we know that these methods are not only complex - they're also long.
So, how about the yellow blocks? Closer inspection reveals they're indeed long methods - but but without the number of IFs that are present in the other too.
At this point - we know that these methods are large and complex - but do they interact with a lot of other classes or objects - or do they just stick to themselves? This question goes in the direction of god objects of course:
In object-oriented programming, a god object is an object that knows too much or does too much. The god object is an example of an anti-pattern. The basic idea behind programming is that a big problem is separated into several smaller problems (a divide and conquer strategy) and solutions are created for each of them.
So in order to identify the GOD objects, we need to tweak the controls a bit. You can manually create almost any combination of Level/Size/Color - but you can also use the quick preset button at the top left. Patrick suggested me to use the Level : Type - Size: types using me - Color: types used. setting. It shows me this:

The red block on the bottom right shows the repository - but the main method is nowhere to be seen. Makes sense though - as the size is deterimed by the number of types using me. The program class is not used by anyone ( at least - not through code ) so doesn't even show up. So maybe the Program.cs is not a GOD object in this sense. But let's see if we can find it through another visualisation:

Just using LOC for size and #types used for color makes it painfully clear that the main() method is 336 lines and calls 94 (!) different types.
To recap, what I think the priorities are to improve maintainability:
- Refactor the main() method
- Refactor the repository
- Split up the utilities project
Of course - I probably need to start writing tests first in order to have some kind of mechanism to check that I'm not breaking any implementations.
I think NDepend is a very valuable tool to have on my belt. When I started on this codebase, I didn't have NDepend and I figured the problems with the code out by searching through it. With NDepend I would have identified these issues - A LOT - easier and faster.
Furthermore, this tool allows me to make it clear to management that we're lacking quality. As a developer, you can only hope that management understands the importance of code maintainability. If not - it's a very difficult discussion everytime. This tool would help with arguing why code quality needs to improve - AND - report on the progress of the improvement. Also - it shows that it's not 'just an opinion' - but that the code lacks quality measured with an objective tool.
Next time - I'll use the tool to analyse and inspect my changes to the project and see how I can improve myself with it!
No comments:
Post a Comment